
Logo
Decide better.Live better.
My feedToday
Logo
Decide better.Live better.
My feedToday
Logo
My feedToday

Stay Curious. Stay Wanture.

© 2026 Wanture. All rights reserved.

  • Terms of Use
  • Privacy Policy
Logo
Decide better.Live better.
My feedTodayTechScienceHealthMobilityMindProductivityHomeExperiencesLongevity
Logo
Decide better.Live better.
My feedTodayTechScienceHealthMobilityMindProductivityHomeExperiencesLongevity
Logo
My feedTodayTechScienceHealthMobilityMindProductivityHomeExperiencesLongevity

Biological Age Tests: How They Work and What They Reveal

Discover how epigenetic clocks, blood panels, wearables, and AI combine to turn your age score into a targeted health plan

Biological Age Tests: How They Work and What They Reveal

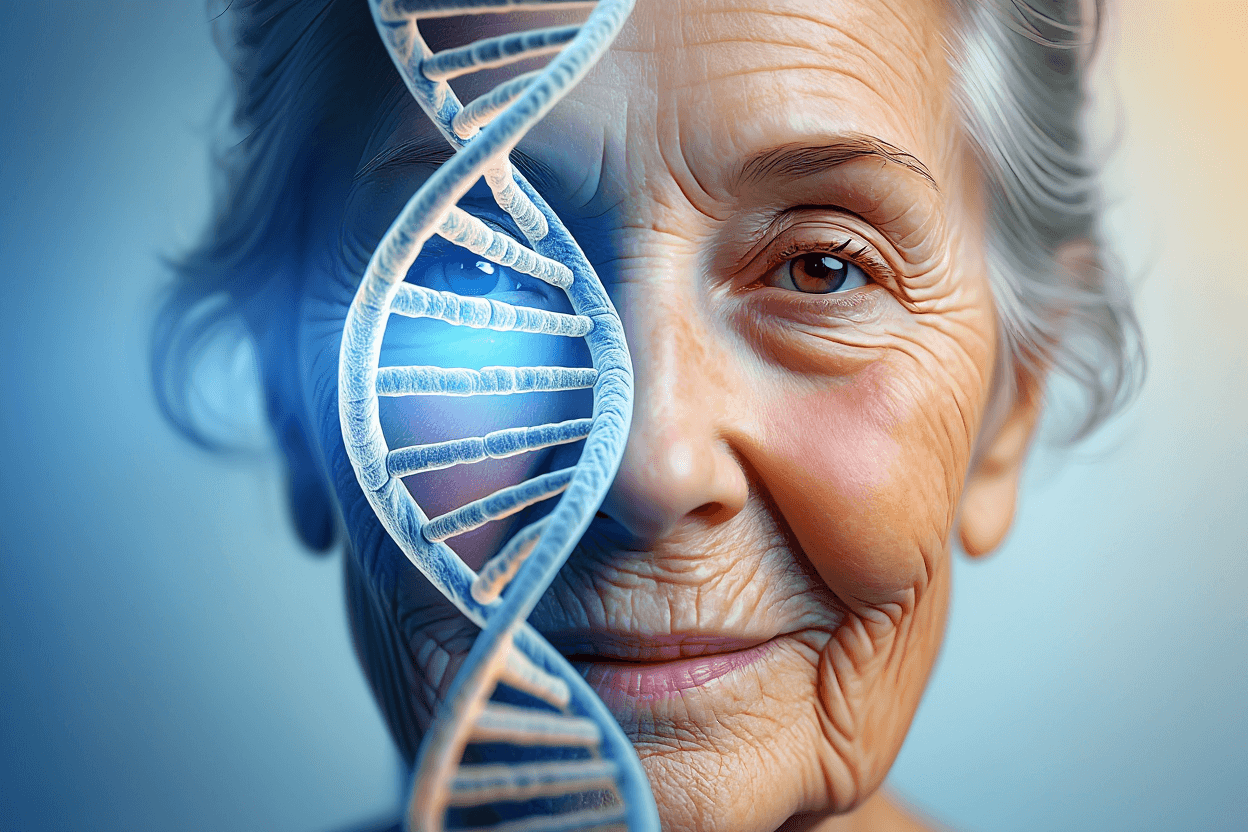
Biological age tests have moved from niche labs to everyday use, covering DNA‑methylation clocks, blood panels such as PhenoAge, wearable fitness metrics, organ imaging, and AI composites. This explainer shows how each method works, what it predicts for mortality and disease, and how to turn the results into concrete sleep, nutrition, and exercise plans.

20 March 2026

—

Explainer

Marcus Lee
banner

Summary:

  • Biological age measures how well body systems function, unlike calendar age, and a lower biological age signals reduced inflammation and stronger heart health.
  • Four tests—epigenetic clocks, blood biomarker panels, wearable fitness metrics, and organ imaging—vary in cost, result speed, and health insight they provide.
  • Pick one or two tests that match your goals, track trends for 3‑6 months, and adjust sleep, diet, exercise, or medication based on each metric’s signal.

Biological age testing has moved from niche labs into consumer hands. Direct-to-consumer kits are expanding fast. Wearable sensors track heart rate variability every night. Clinicians now use age metrics to guide preventive care. Understanding how each test works, what it predicts, and how to act on the results can turn a single number into a roadmap for better sleep, nutrition, and movement.

How Biological Age Differs from Chronological Age

Biological age estimates the functional state of body systems. Chronological age counts birthdays. Biological age reflects how well cells repair, how arteries respond to stress, and how muscles recover. A 45-year‑old with a biological age of 35 may have lower inflammation and stronger heart function than a peer whose biological age matches their calendar years.

Why Biological Age Tests Give Different Numbers

Each test models a different layer of physiology. Epigenetic clocks read DNA methylation. Biochemical panels analyze blood chemistry. Functional assessments measure fitness capacity. Because the inputs vary, the outputs can diverge. Yet each number is valid within its own framework. Comparing raw numbers across different platforms is a common mistake—what matters is tracking trends within a single method over time.

Four Methods for Calculating Biological Age

Four broad categories dominate the market. They are epigenetic clocks, biochemical models, physiological fitness measures, and organ-specific imaging. Selecting one or two methods that align with personal goals yields the most actionable insight.

Epigenetic Clocks: DNA Methylation Testing

Epigenetic clocks decode chemical tags on DNA that accumulate with cell division. The Horvath Clock and GrimAge examine hundreds of methylation sites. They translate patterns into an age estimate.

A meta‑analysis of 15,013 participants across 15 cohorts found that individuals whose epigenetic age exceeded chronological age by ten years faced a 40 percent higher risk of death over the next decade. This link between methylation age and mortality is robust across diverse populations. The Aging Cell 2022 meta‑analysis provides the evidence.

Tests cost $200 to $500 and require a lab draw. Results take weeks. This makes them less convenient for frequent monitoring but highly predictive of long‑term risk.

Biochemical Models: Blood Test Biomarkers

Biochemical models combine routine blood markers with age to predict health outcomes. PhenoAge, derived from the NHANES cohort, uses nine markers plus chronological age. The markers are albumin, creatinine, glucose, C‑reactive protein, lymphocyte percentage, mean corpuscular volume, red cell distribution width, alkaline phosphatase, and white blood cell count.

An observational analysis of 15,320 U.S. adults showed that higher PhenoAge scores correlated with a 25 percent increase in all‑cause mortality. This held after adjusting for lifestyle factors. PhenoAge captures metabolic and inflammatory stress that drives aging. The NHANES study documents the association.

The assay costs under $100 through standard labs. Results return in days. This allows quarterly tracking. Short‑term illnesses can temporarily raise scores, so trends over months are more informative than single readings.

Physiological Models: Functional Fitness Measures

Functional models assess what the body can do in real time. Maximal oxygen uptake (VO₂max) quantifies cardiovascular efficiency. Heart rate variability (HRV) reflects autonomic balance.

A JACC 2023 study of 93,060 participants demonstrated that each 1.0 MET increase in cardiorespiratory fitness reduced all‑cause mortality risk proportionally. Declines in fitness raised risk sharply. Fitness metrics link directly to lifespan. The JACC 2023 study provides the data.

Wearables such as Oura Ring estimate VO₂max and HRV from nightly pulse and activity. They deliver updates weekly. Because fitness adapts quickly to training, these measures are ideal for evaluating exercise or sleep interventions.

Organ‑Specific Aging Clocks

Imaging tests reveal age‑related changes in particular organs. Coronary artery calcium scoring uses low‑dose CT to quantify plaque. A score above 100 signals accelerated arterial aging and prompts intensified lipid management.

Carotid intima‑media thickness measured by ultrasound predicts stroke risk. Brain MRI‑derived age estimates compare white‑matter lesions to age‑matched norms. These tests do not produce a single age number. They highlight where preventive action is most needed.

Comparing the Four Methods

  • Epigenetic clocks: $200 to $500, weeks for results, measures DNA methylation, best for long‑term mortality risk prediction
  • Biochemical models (PhenoAge): under $100, days for results, measures blood markers, best for quarterly metabolic and inflammation tracking
  • Physiological fitness (VO₂max, HRV): $0 to $300 for wearable, weekly updates, measures cardiovascular and autonomic function, best for short‑term exercise and sleep intervention tracking
  • Organ‑specific imaging: $100 to $500 per scan, days for results, measures structural changes in arteries or brain, best for targeted preventive action in specific organs

How to Select, Track, and Act on Results

Choose one or two tools based on your goals and timeline. If you want to track quick responses to lifestyle changes, use wearable‑based VO₂max or HRV. Track VO₂max monthly after starting a running program to see fitness gains within 8 to 12 weeks. If you are focused on long‑term metabolic health, retest PhenoAge quarterly when changing diet. Compare trends rather than single readings.

For long‑term mortality risk assessment, order an epigenetic clock test annually. Pair it with PhenoAge to capture both genetic and metabolic layers. This combination provides both a baseline risk forecast and a responsive metric for behavior change.

Use the data to guide specific actions. A high PhenoAge score with elevated C‑reactive protein signals inflammation—prioritize anti‑inflammatory foods and adequate sleep. A declining VO₂max prompts a return to structured cardio training. A rising coronary calcium score leads to a discussion with a clinician about statin therapy or intensified lipid control.

Track trends over at least three to six months before adjusting strategy. Single readings fluctuate with illness, stress, and measurement error. Consistent patterns reveal whether sleep improvements, dietary shifts, or exercise programs are moving the needle. The goal is not to chase an ideal age number but to reduce risk, improve function, and slow the rate of system degradation. These tests translate physiological change into a guide for living longer and better.

What is this about?

  • Explainer/
  • Marcus Lee/
  • Health/
  • Prevention/
  • Wearable health detection/
  • inflammation biomarkers/
  • muscle health/
  • Epigenetic Clocks/
  • Biological Age Testing

Feed

    Apple Targets 15-Product Rollout in Late 2026

    Apple Targets 15-Product Rollout in Late 2026

    New iPhones, Macs, and Home Hub arrive amid RAM shortages and Siri updates

    Jordan McAllister41 minutes ago
    Apple Watch Ultra 4 could track blood pressure trends

    Apple Watch Ultra 4 could track blood pressure trends

    A potential hardware redesign with 8 sensors aims to move from simple alerts to direct cardiovascular measurement

    Ben Ramos4 days ago

    Your earbuds could become a secure digital key via your heartbeat

    AccLock uses standard accelerometers to verify identity without needing premium optical heart trackers

    Ben Ramos5 days ago
    Memory chip shortages could end by 2027

    Memory chip shortages could end by 2027

    Aggressive Chinese production expansions from YMTC and CXMT may lower hardware costs sooner than the 2030 consensus

    Ben Ramos5 days ago
    Hisense Explorer X1 Pro brings 120-inch cinema to your living room

    Hisense Explorer X1 Pro brings 120-inch cinema to your living room

    A new tri-color laser engine offers 110% BT.2020 color gamut, though US availability remains unannounced

    Logan Price5 days ago
    Onyx Boox Poke 7 series brings paper-like clarity to your library

    Onyx Boox Poke 7 series brings paper-like clarity to your library

    New 300 ppi displays and 2 TB expandable storage offer a sharper, larger reading experience

    Ben Ramos5 days ago
    SpaceX IPO: A historic bet on the space economy

    SpaceX IPO: A historic bet on the space economy

    With 2025 revenue hitting $18.6 billion, the Nasdaq debut tests market appetite for Elon Musk

    Jasmine Wu5 days ago
    Figma AI agents turn manual design into high-level direction

    Figma AI agents turn manual design into high-level direction

    New intent-based tools allow designers to build layouts using natural language instead of clicking and dragging

    Evelyn Park5 days ago
    NanoClaw's sandbox stops AI agents from compromising your OS

    NanoClaw's sandbox stops AI agents from compromising your OS

    NanoCo secures $12 million to scale its isolated architecture for enterprise AI deployment

    Marcus Dillard5 days ago

    Microsoft's new Surface lineup is for businesses, not consumers

    Wait for Snapdragon X2 models this summer if you aren't buying for an enterprise fleet

    Carter Brooks5 days ago
    Loading...

Biological Age Tests: How They Work and What They Reveal

Discover how epigenetic clocks, blood panels, wearables, and AI combine to turn your age score into a targeted health plan

March 20, 2026, 4:04 pm

Biological age tests have moved from niche labs to everyday use, covering DNA‑methylation clocks, blood panels such as PhenoAge, wearable fitness metrics, organ imaging, and AI composites. This explainer shows how each method works, what it predicts for mortality and disease, and how to turn the results into concrete sleep, nutrition, and exercise plans.

Biological Age Tests: How They Work and What They Reveal

Summary

  • Biological age measures how well body systems function, unlike calendar age, and a lower biological age signals reduced inflammation and stronger heart health.
  • Four tests—epigenetic clocks, blood biomarker panels, wearable fitness metrics, and organ imaging—vary in cost, result speed, and health insight they provide.
  • Pick one or two tests that match your goals, track trends for 3‑6 months, and adjust sleep, diet, exercise, or medication based on each metric’s signal.

Biological age testing has moved from niche labs into consumer hands. Direct-to-consumer kits are expanding fast. Wearable sensors track heart rate variability every night. Clinicians now use age metrics to guide preventive care. Understanding how each test works, what it predicts, and how to act on the results can turn a single number into a roadmap for better sleep, nutrition, and movement.

How Biological Age Differs from Chronological Age

Biological age estimates the functional state of body systems. Chronological age counts birthdays. Biological age reflects how well cells repair, how arteries respond to stress, and how muscles recover. A 45-year‑old with a biological age of 35 may have lower inflammation and stronger heart function than a peer whose biological age matches their calendar years.

Why Biological Age Tests Give Different Numbers

Each test models a different layer of physiology. Epigenetic clocks read DNA methylation. Biochemical panels analyze blood chemistry. Functional assessments measure fitness capacity. Because the inputs vary, the outputs can diverge. Yet each number is valid within its own framework. Comparing raw numbers across different platforms is a common mistake—what matters is tracking trends within a single method over time.

Four Methods for Calculating Biological Age

Four broad categories dominate the market. They are epigenetic clocks, biochemical models, physiological fitness measures, and organ-specific imaging. Selecting one or two methods that align with personal goals yields the most actionable insight.

Epigenetic Clocks: DNA Methylation Testing

Epigenetic clocks decode chemical tags on DNA that accumulate with cell division. The Horvath Clock and GrimAge examine hundreds of methylation sites. They translate patterns into an age estimate.

A meta‑analysis of 15,013 participants across 15 cohorts found that individuals whose epigenetic age exceeded chronological age by ten years faced a 40 percent higher risk of death over the next decade. This link between methylation age and mortality is robust across diverse populations. The Aging Cell 2022 meta‑analysis provides the evidence.

Tests cost $200 to $500 and require a lab draw. Results take weeks. This makes them less convenient for frequent monitoring but highly predictive of long‑term risk.

Biochemical Models: Blood Test Biomarkers

Biochemical models combine routine blood markers with age to predict health outcomes. PhenoAge, derived from the NHANES cohort, uses nine markers plus chronological age. The markers are albumin, creatinine, glucose, C‑reactive protein, lymphocyte percentage, mean corpuscular volume, red cell distribution width, alkaline phosphatase, and white blood cell count.

An observational analysis of 15,320 U.S. adults showed that higher PhenoAge scores correlated with a 25 percent increase in all‑cause mortality. This held after adjusting for lifestyle factors. PhenoAge captures metabolic and inflammatory stress that drives aging. The NHANES study documents the association.

The assay costs under $100 through standard labs. Results return in days. This allows quarterly tracking. Short‑term illnesses can temporarily raise scores, so trends over months are more informative than single readings.

Physiological Models: Functional Fitness Measures

Functional models assess what the body can do in real time. Maximal oxygen uptake (VO₂max) quantifies cardiovascular efficiency. Heart rate variability (HRV) reflects autonomic balance.

A JACC 2023 study of 93,060 participants demonstrated that each 1.0 MET increase in cardiorespiratory fitness reduced all‑cause mortality risk proportionally. Declines in fitness raised risk sharply. Fitness metrics link directly to lifespan. The JACC 2023 study provides the data.

Wearables such as Oura Ring estimate VO₂max and HRV from nightly pulse and activity. They deliver updates weekly. Because fitness adapts quickly to training, these measures are ideal for evaluating exercise or sleep interventions.

Organ‑Specific Aging Clocks

Imaging tests reveal age‑related changes in particular organs. Coronary artery calcium scoring uses low‑dose CT to quantify plaque. A score above 100 signals accelerated arterial aging and prompts intensified lipid management.

Carotid intima‑media thickness measured by ultrasound predicts stroke risk. Brain MRI‑derived age estimates compare white‑matter lesions to age‑matched norms. These tests do not produce a single age number. They highlight where preventive action is most needed.

Comparing the Four Methods

  • Epigenetic clocks: $200 to $500, weeks for results, measures DNA methylation, best for long‑term mortality risk prediction
  • Biochemical models (PhenoAge): under $100, days for results, measures blood markers, best for quarterly metabolic and inflammation tracking
  • Physiological fitness (VO₂max, HRV): $0 to $300 for wearable, weekly updates, measures cardiovascular and autonomic function, best for short‑term exercise and sleep intervention tracking
  • Organ‑specific imaging: $100 to $500 per scan, days for results, measures structural changes in arteries or brain, best for targeted preventive action in specific organs

How to Select, Track, and Act on Results

Choose one or two tools based on your goals and timeline. If you want to track quick responses to lifestyle changes, use wearable‑based VO₂max or HRV. Track VO₂max monthly after starting a running program to see fitness gains within 8 to 12 weeks. If you are focused on long‑term metabolic health, retest PhenoAge quarterly when changing diet. Compare trends rather than single readings.

For long‑term mortality risk assessment, order an epigenetic clock test annually. Pair it with PhenoAge to capture both genetic and metabolic layers. This combination provides both a baseline risk forecast and a responsive metric for behavior change.

Use the data to guide specific actions. A high PhenoAge score with elevated C‑reactive protein signals inflammation—prioritize anti‑inflammatory foods and adequate sleep. A declining VO₂max prompts a return to structured cardio training. A rising coronary calcium score leads to a discussion with a clinician about statin therapy or intensified lipid control.

Track trends over at least three to six months before adjusting strategy. Single readings fluctuate with illness, stress, and measurement error. Consistent patterns reveal whether sleep improvements, dietary shifts, or exercise programs are moving the needle. The goal is not to chase an ideal age number but to reduce risk, improve function, and slow the rate of system degradation. These tests translate physiological change into a guide for living longer and better.

What is this about?

  • Explainer/
  • Marcus Lee/
  • Health/
  • Prevention/
  • Wearable health detection/
  • inflammation biomarkers/
  • muscle health/
  • Epigenetic Clocks/
  • Biological Age Testing

Feed

    Apple Targets 15-Product Rollout in Late 2026

    Apple Targets 15-Product Rollout in Late 2026

    New iPhones, Macs, and Home Hub arrive amid RAM shortages and Siri updates

    Jordan McAllister41 minutes ago
    Apple Watch Ultra 4 could track blood pressure trends

    Apple Watch Ultra 4 could track blood pressure trends

    A potential hardware redesign with 8 sensors aims to move from simple alerts to direct cardiovascular measurement

    Ben Ramos4 days ago

    Your earbuds could become a secure digital key via your heartbeat

    AccLock uses standard accelerometers to verify identity without needing premium optical heart trackers

    Ben Ramos5 days ago
    Memory chip shortages could end by 2027

    Memory chip shortages could end by 2027

    Aggressive Chinese production expansions from YMTC and CXMT may lower hardware costs sooner than the 2030 consensus

    Ben Ramos5 days ago
    Hisense Explorer X1 Pro brings 120-inch cinema to your living room

    Hisense Explorer X1 Pro brings 120-inch cinema to your living room

    A new tri-color laser engine offers 110% BT.2020 color gamut, though US availability remains unannounced

    Logan Price5 days ago
    Onyx Boox Poke 7 series brings paper-like clarity to your library

    Onyx Boox Poke 7 series brings paper-like clarity to your library

    New 300 ppi displays and 2 TB expandable storage offer a sharper, larger reading experience

    Ben Ramos5 days ago
    SpaceX IPO: A historic bet on the space economy

    SpaceX IPO: A historic bet on the space economy

    With 2025 revenue hitting $18.6 billion, the Nasdaq debut tests market appetite for Elon Musk

    Jasmine Wu5 days ago
    Figma AI agents turn manual design into high-level direction

    Figma AI agents turn manual design into high-level direction

    New intent-based tools allow designers to build layouts using natural language instead of clicking and dragging

    Evelyn Park5 days ago
    NanoClaw's sandbox stops AI agents from compromising your OS

    NanoClaw's sandbox stops AI agents from compromising your OS

    NanoCo secures $12 million to scale its isolated architecture for enterprise AI deployment

    Marcus Dillard5 days ago

    Microsoft's new Surface lineup is for businesses, not consumers

    Wait for Snapdragon X2 models this summer if you aren't buying for an enterprise fleet

    Carter Brooks5 days ago
    Loading...
Home
Home
Search
Search
banner