
If you're over 30 and tracking bloodwork, five biomarkers deserve tighter targets than your lab report suggests. Florence Comite, M.D., founder of the Comite Center for Precision Medicine and author of Invincible, doesn't compare patients to population averages. She asks what your bloodwork would look like if you were functioning at your physiological best, somewhere between ages 25 and 30. That reframing changes everything, especially when you consider that more than 2 in 5 U.S. adults have prediabetes and metabolic syndrome affects roughly 37% of the adult population. Standard lab reference ranges are built on population averages, and that population includes a lot of unhealthy people.
The result? Lab values considered "normal" might actually be steering you toward metabolic decline, not peak performance. The five biomarkers below represent the core metrics Comite tracks for longevity, along with the optimal ranges she targets. These ranges are often significantly tighter than what most lab reports flag as "normal." If you're serious about healthspan optimization, these numbers deserve your attention.
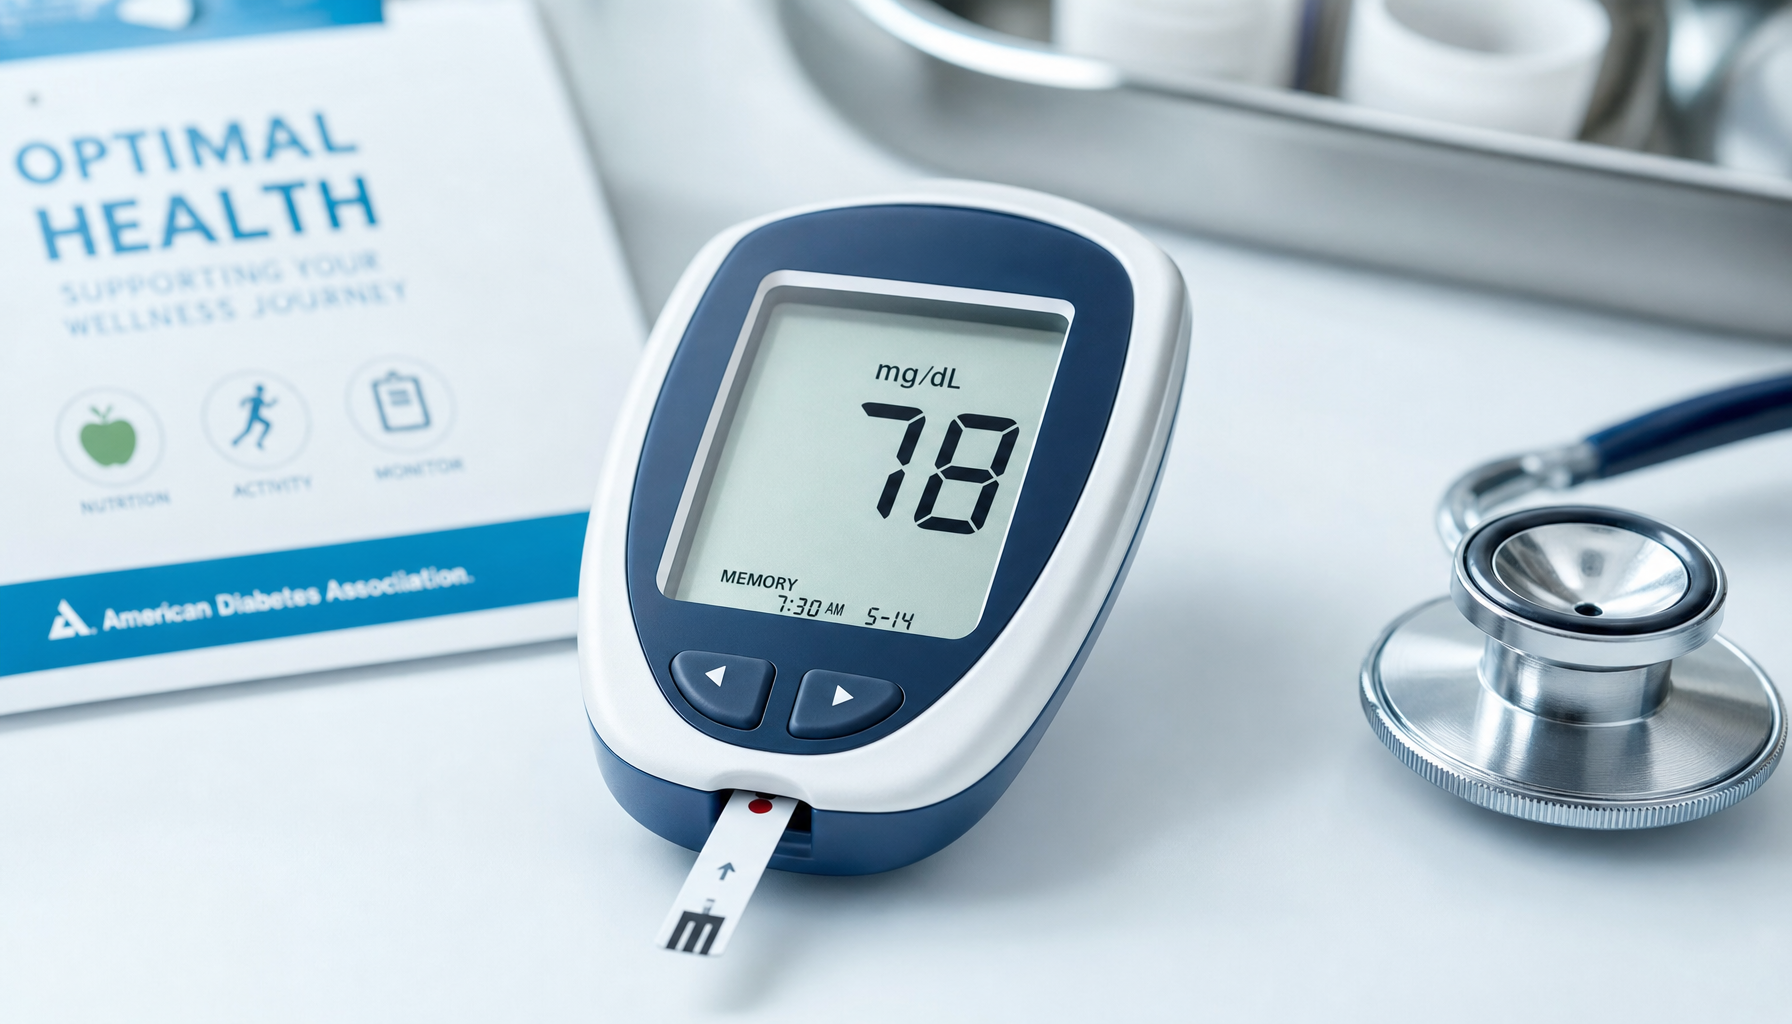
Fasting Glucose: 70–80 mg/dL
Fasting glucose measures your baseline blood sugar after an overnight fast. Most lab reports will call anything under 100 mg/dL "normal," and prediabetes doesn't officially start until 100–125 mg/dL. Comite sets the bar much lower: she wants fasting glucose between 70 and 80 mg/dL.
A single morning measurement only captures one moment in time. Comite recommends wearing a continuous glucose monitor (CGM) if you want to see how your levels fluctuate throughout the day in response to meals, exercise, and stress. After eating, she explains, you don't want glucose climbing much beyond 120 mg/dL. During intense exercise, a spike to 150 or even 180 can be normal, but hitting 200 or above warrants attention and discussion with your physician.
![]()
Most people worry about glucose running too high, but it can also drop too low. If you're practicing extended fasting and your levels fall below 70 mg/dL, you may be experiencing hypoglycemia, a condition that can cause confusion, shakiness, and in severe cases requires immediate medical attention. Always consult your healthcare provider before beginning any fasting regimen, especially if you take medications that affect blood sugar.
Fasting Insulin: 2–5 μIU/mL
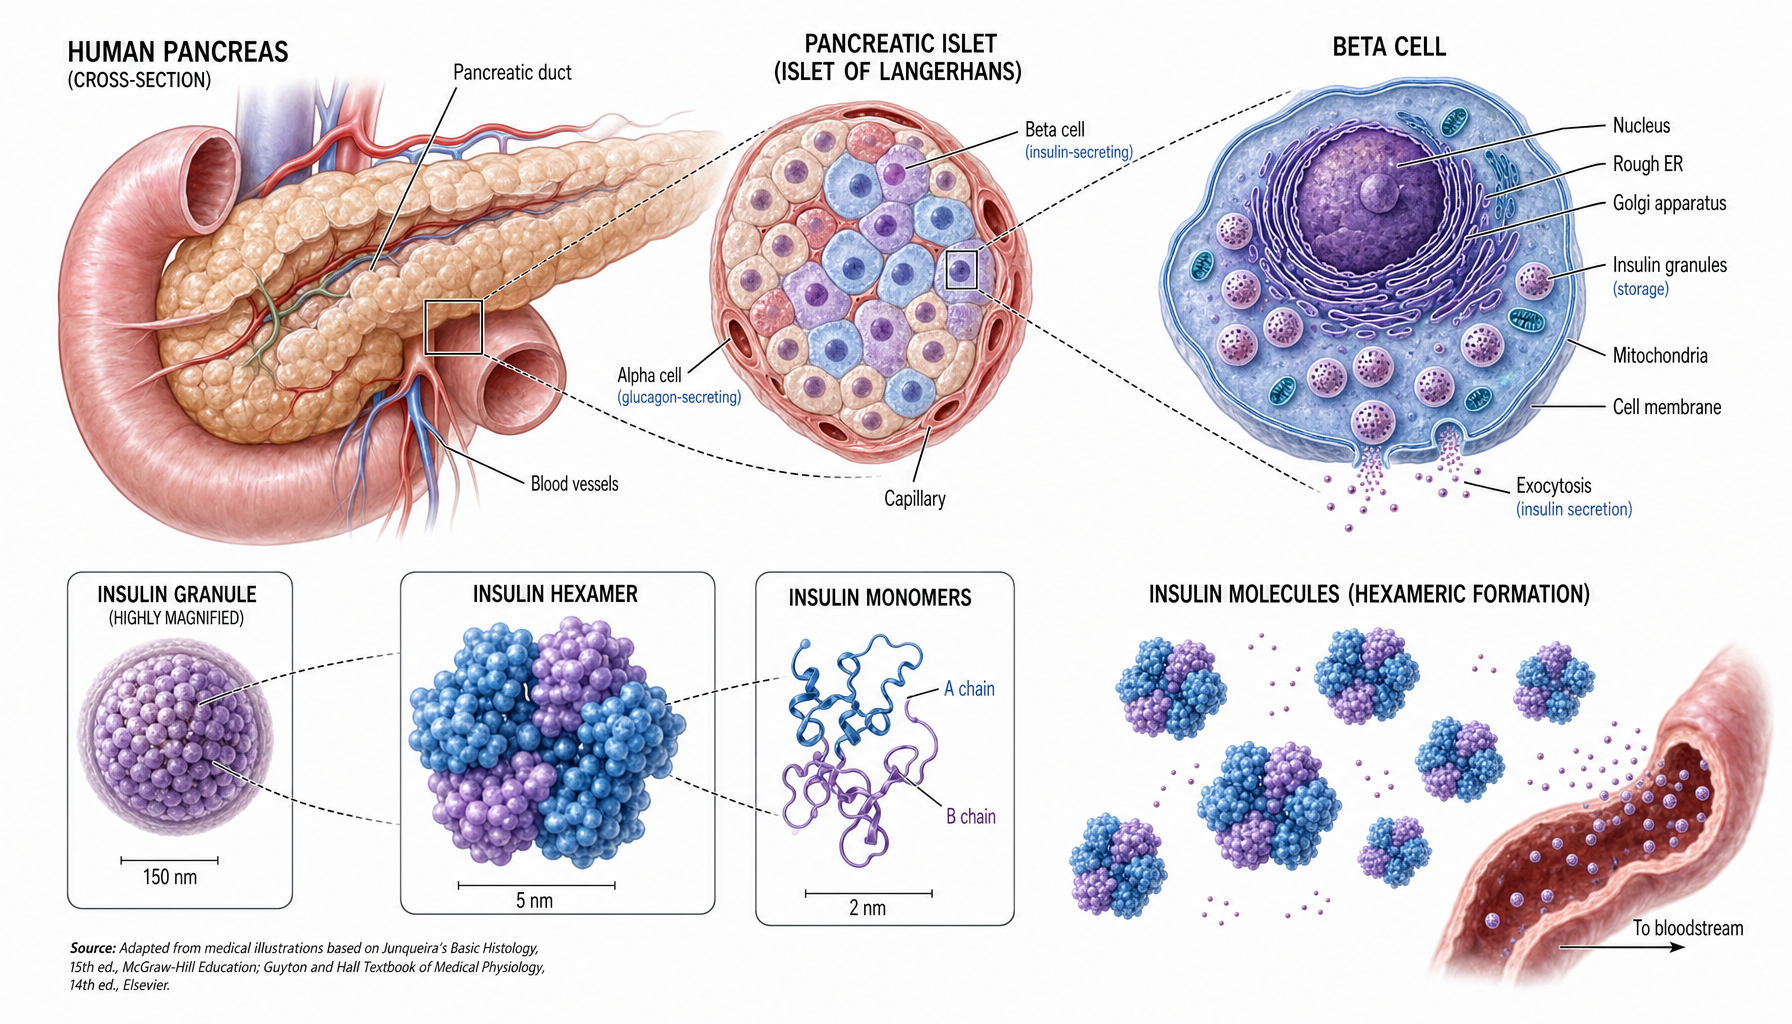
Fasting insulin is one of the most underutilized biomarkers in routine care. Most doctors don't order it, and some lab reports still list "normal" as anything up to 24.9 μIU/mL, a range Comite considers absurdly high. She wants fasting insulin between 2 and 5 μIU/mL, ideally trending toward undetectable.
Why does elevated fasting insulin matter, even when it falls within the "normal" range? Insulin is a storage hormone released by the pancreas in response to rising blood sugar. In healthy individuals, insulin typically peaks about 30–60 minutes after a meal and returns toward baseline over the next few hours. If insulin remains elevated while you're fasting, that signals insulin resistance, a state in which your cells have become less responsive to insulin's signals, forcing the pancreas to pump out more hormone to achieve the same glucose-clearing effect.
Elevated insulin doesn't just correlate with metabolic dysfunction. It drives it through specific physiological pathways. Chronically high insulin activates inflammatory signaling cascades, particularly through stress kinases like JNK and IKKβ, which phosphorylate insulin receptor substrates on serine residues rather than tyrosine. That modification impairs downstream signaling through the PI3K–AKT pathway, reducing glucose uptake into cells and creating a vicious cycle: higher insulin leads to worse insulin signaling, which demands even higher insulin. This chronic low-grade inflammation, sometimes called "metaflammation," sits at the root of diabetes, stroke, cardiovascular disease, and even certain cancers.
Comite considers fasting insulin one of the most important numbers to know, yet it rarely appears on a standard metabolic panel. You'll need to request it specifically. Laboratory reference intervals vary by assay, so always interpret your results using the specific reference range provided by your testing facility. What constitutes "optimal" also remains debated. Population-based reference intervals reflect the central 95% of whoever was sampled, often including people with overweight or obesity, which drives those upper limits higher than values associated with low cardiometabolic risk in longevity research.
Hemoglobin A1C: Under 5.0%
Hemoglobin A1C (often shortened to A1C) reflects your average blood sugar over approximately the past 2–3 months. It works by measuring the percentage of hemoglobin (the oxygen-carrying protein in red blood cells) that has glucose attached to it. The higher your average glucose, the higher your A1C.
Conventional cutoffs classify anything under 5.7% as "normal," with prediabetes beginning at 5.7% and diabetes starting at 6.5%. Comite wants A1C under 5.0%. She views anything creeping toward 5.4%, 5.5%, or 5.6% as already heading toward prediabetes, even though most lab reports won't flag it.
Why does this distinction matter physiologically? The glucose that attaches to hemoglobin in the A1C test is an early example of glycation, a non-enzymatic chemical reaction between sugars and proteins that, over time, produces advanced glycation end-products (AGEs). AGEs cause protein cross-linking in long-lived tissues like collagen and elastin, increasing arterial stiffness and impairing organ function. They also bind to the receptor for advanced glycation end-products (RAGE) on many cell types, triggering NF-κB and MAPK signaling pathways that ramp up pro-inflammatory cytokine release and oxidative stress. This cascade, sometimes called "inflammaging," drives DNA damage, mitochondrial dysfunction, telomere shortening, and cellular senescence. In other words, elevated A1C doesn't just predict diabetes; it reflects an accelerated cellular aging process already underway.
One important caveat: A1C is an average, which means it can mask wide swings between highs and lows. A person with stable glucose at 90 mg/dL and someone oscillating between 60 and 140 mg/dL might have the same A1C. That's why Comite doesn't rely on A1C alone. She pairs it with fasting glucose, fasting insulin, and ideally CGM data to see the full metabolic picture. A1C can be inaccurate in certain conditions, including anemia, hemoglobin variants, and kidney disease.
Cholesterol Risk Ratio: Total Cholesterol ÷ HDL
Rather than fixating on total cholesterol or LDL alone, Comite tracks the cholesterol risk ratio, calculated by dividing total cholesterol by HDL (high-density lipoprotein, the "good" cholesterol). The lower the ratio, the better your cardiovascular risk profile.
This ratio doesn't require expensive specialty testing. It can be calculated from a standard lipid panel available through Quest Diagnostics or LabCorp, making it one of the most accessible cardiovascular risk markers for routine tracking. While Comite didn't specify an exact optimal range in our conversation, she views this ratio as a practical stand-in for cardiovascular health that most people can monitor with their regular bloodwork.
Free Testosterone: 180–250 pg/mL (Men), 6–30 pg/mL (Women)
Testosterone isn't just a male hormone. It's a major longevity lever for both sexes, affecting metabolism, muscle mass, insulin sensitivity, mood, cognition, memory, and cardiovascular risk. And it starts declining by approximately 1–2% per year starting in your thirties.
Comite emphasizes free testosterone over total testosterone. Total testosterone includes hormone bound to proteins like sex hormone-binding globulin (SHBG) and albumin. Free testosterone is the unbound fraction, the portion that's actually available for your tissues to use.
For men, her optimal range is 180–250 pg/mL, which is significantly higher than what most labs consider "normal." For women, she aims for at least 6 pg/mL, and up to 30 pg/mL, reflecting wider individual variation. Standard lab ranges for women often set the upper limit much lower, sometimes as low as 10 pg/mL, which Comite considers inadequate for optimal function.
One critical caveat: testosterone assay methodology matters enormously. Free testosterone reference ranges vary significantly by testing method. Equilibrium dialysis and certain calculation methods are preferred over direct immunoassays, which can be less accurate, particularly at low concentrations. If your result sits near a clinical decision threshold, consider requesting confirmation with LC-MS/MS (liquid chromatography–tandem mass spectrometry), a more precise analytic approach.
What to Do With This Information
Knowing optimal ranges is only useful if you act on them. Start by requesting the specific tests. Most annual physicals include fasting glucose and a lipid panel, but fasting insulin, A1C, and free testosterone are often left out. You'll need to ask your doctor to order them. If you encounter resistance, explain that you want a more complete picture of metabolic and hormonal health, not just disease screening.
Next, get tested at least twice. Comite recommends obtaining at least two measurements, both taken first thing in the morning after an overnight fast, to ensure consistency. A single data point can be influenced by sleep quality, recent illness, or lab error.
Then, look beyond "normal." If your results fall within the standard reference range but don't hit the optimal targets above, that's worth a conversation with your doctor. Bring these specific ranges to your appointment and ask how your results compare. Remember that Dr. Comite's optimal ranges represent precision medicine targets for performance optimization, not standard medical guidelines for disease diagnosis. Always work with your physician to interpret results in the context of your overall health.
Consider wearing a CGM. Continuous glucose monitors are no longer limited to people with diabetes. Several companies now offer CGMs direct to consumer, allowing you to see how your body responds to food, exercise, stress, and sleep in real time, not just in a single fasting snapshot. This is particularly useful if your fasting glucose or A1C is creeping upward but hasn't yet crossed into official prediabetes territory. Be aware that these devices typically cost between $70–$100 per month without insurance coverage.
Finally, talk to your doctor about optimization strategies. If your biomarkers are trending in the wrong direction, there are evidence-based approaches to consider. Weight loss in people with overweight or obesity reliably improves insulin sensitivity, and resistance training has been shown to improve metabolic health. For testosterone optimization, some approaches focus on stimulating the body's own production, such as low-dose hCG therapy or lifestyle interventions, rather than introducing exogenous hormones. These are nuanced conversations best had with a physician who specializes in hormone optimization or precision medicine, and any treatment carries risks that should only be pursued under qualified medical supervision.
The standard reference ranges printed on your lab report are designed to catch disease, not optimize performance. Comite's approach flips that script: instead of waiting until you're sick, she tracks the early warning signs of metabolic and hormonal decline and intervenes while there's still time to course-correct. These five biomarkers offer a clearer picture of how your body is actually functioning, not how you compare to a population average that includes people decades into metabolic dysfunction.